1. Introduction to FPIA
Gene fusion is a key type of molecular alternations that originated from separate genes with aberrant functions. Although recent years have witnessed development of gene fusion databases, a tool with interactive analytic functions is still lacking. Here, we introduce FPIA (Fusion Profiling Interactive Analysis), a web server to perform dynamic and customizable functions including gene expression, tumor purity and ploidy, mutation, copy number variations, levels of immune cells, stem indices, telomere length, micro satellite instability and survival for gene fusions based on 33 cancer types from TCGA data. Currently, it contains 31,633 fusion events from 6,910 patients. FPIA complements the existing gene fusion annotation databases with its multi-omic analytic capacity, integrated analysis features, customized analysis selection and user-friendly design. The comprehensive data analyses by FPIA will greatly facilitate data mining, hypothesis generation and therapeutic target discovery. This website is free and open to all users and there is no login requirement.
2. Construction of FPIA
2.1 TCGA fusion genes collection and annotation
The fusion genes were collected from Gao et al and Hu et al, which contained 25,664 and 20,731 fusion genes, respectively. Duplicated fusion genes that with the same breakpoints and fusion partner genes were removed, resulting in a total of 31,633 non-redundant fusion genes (based on GRCh38 build assembly) genes from 6,910 patients. For the fusion genes of each cancer, the location of breakpoints was annotated using ANNOVAR, which includes exonic, splicing (within 2-bp of a splicing junction), ncRNA (overlaps a transcript without coding annotation in the gene definition), UTR5, UTR3, intronic, upstream (overlaps 1-kb region upstream of transcription start site), downstream (overlaps 1-kb region downstream of transcription end site), and intergenic. Moreover, we consulted the CancerMine database and annotated the oncogenic role of fusion partner genes. In this way, 770 driver genes, 2,287 oncogenes, and 1,736 tumor suppressors were identified. Detailed information of these fusion genes are available in statistic page.
2.2 Interactive fusion gene set selection
FPIA enables users to retrieve and interactively select fusion gene sets of interest. Three tabs, including a fusion browser, a gene browser and a cancer browser were implemented, serving as three different approaches to search fusion genes. Users are able to explore fusion genes based on the full name of the fusion gene, explore the repertoire of fusions that contain certain fusion partner gene, or within certain types of cancer. Each search yields multiple results, including an auxiliary table that provides all qualified fusions, and a plot indicating the distribution of fusion event location in gene structure (e.g., exonic, intronic, and UTR5). For the fusion gene list obtained in each tab, the detailed information for both of partner genes and fusion genes were presented. For each partner gene, it shows the basic gene information with accessions to NCBI, as well as in which cancer the fusion was found, the location of breakpoint in each of the fusion partner gene, and the number of samples with corresponding fusion. Fusion genes can be filtered by specific keywords or specific role of each partner gene in cancerogenesis (e.g., driver gene, kinase, and tumor suppressor). Furthermore, fusion genes can be selected into the collection box at the lower edges of web page from the fusion list interactively using the ‘Add’ button in the ‘Operation’ column, or click ‘Add All’ for batch selection. The collection box enables the users to customized fusion selection, which is crucial for further functionalities.
2.3 Multi-omics fusion-nonfusion comparison
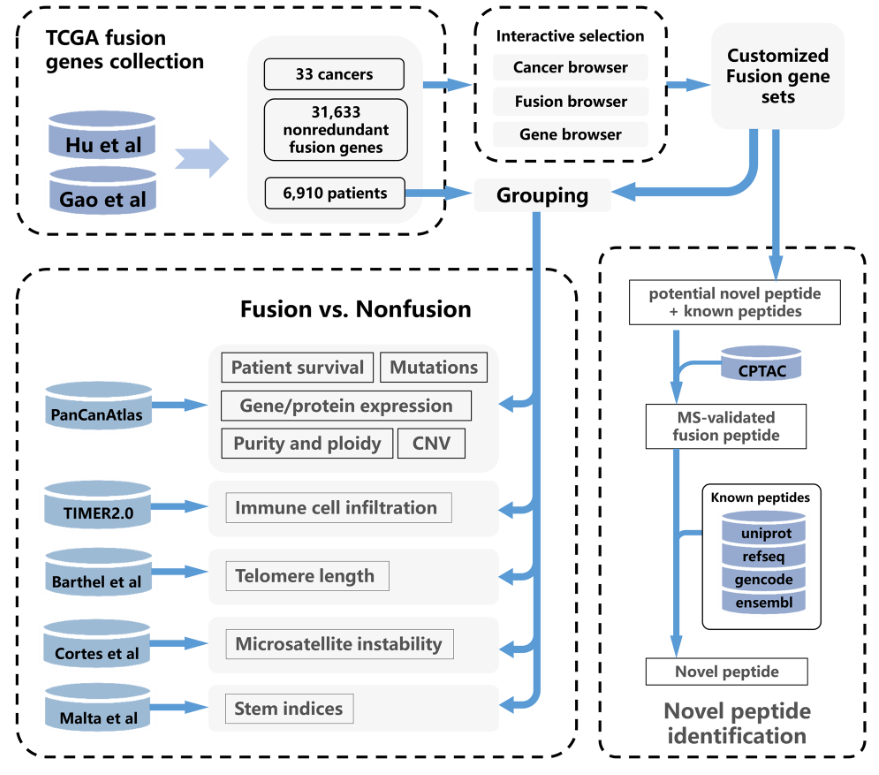
To provide access for the exploration of fusion genes in the context of multiple cancer indices, we leveraged multi-omics data from TCGA-based studies. From PanCanAtlas we obtained normalized gene expression (20,531 genes), tumor purity and ploidy, somatic mutation (2,017,901 mutations), CNV (24,205 genes), 198 proteins and clinical outcome indices across 33 cancers of TCGA. The immune cell component data was collected from TIMER2.0, which include the infiltration level of 22 immune cells in 11,010 tumor samples from TCGA. The stemness indices of tumor was obtained from Malta et. al., which applies six epigenetic and expression-based stemness indices (DMPsi, ENHsi, EREG-mDNAsi, mDNAsi, EREG-mRNAsi, and mRNAsi) to measure oncogenic dedifferentiation (Malta et al., 2018). Furthermore, we obtained the telomere length and microsatellite instability information from earlier reports conducted by Barthel et al. and Cortes et al., respectively.
While fusion gene list of interest was selected, TCGA patients were separated into two groups, fusion group (each patient harbor at least one fusion gene in the list) and non-fusion group (no fusion gene in the list detected). For each of the cancer related index we collected in the multi-omics data, the selected index was then plotted and compared between the two group. Wilcoxon rank-sum test was applied for each of the significance test.
2.4 Novel peptide identification
A three-step procedure was applied to identify fusion-derived novel peptides. In the first step, the 1 kb fusion sequence (500 bp up and down-stream of each breakpoint) for each breakpoint were extracted, followed by 3-frame translation in getorf, which result in all the potential peptide of fusion events (peptide set A). In the second step, peptides with proteomic evidence from cancer were selected from peptide set A. Quantitative mass spectrometry-based proteomic and phosphoproteomic data were identified in seven studies from CPTAC, including gastric cancer, breast cancer, ovarian cancer, colon cancer, clear cell renal cell carcinoma (CCRCC), uterine corpus endometrial carcinoma (UCEC), and colorectal cancer. We applied MSGFPlus to perform peptide identification by scoring peptide set A against MS spectrum identified proteins of seven available cancers, and selected 45,313 peptides with MS support (peptide set B). Finally, we used BLASTP to compare peptide set B with 4 major known peptide databases (uniprot, refseq, gencodev30, and ensembl96), 17,195 peptides that unmatched known peptides were selected as novel peptides.

3. Examples of FPIA usage
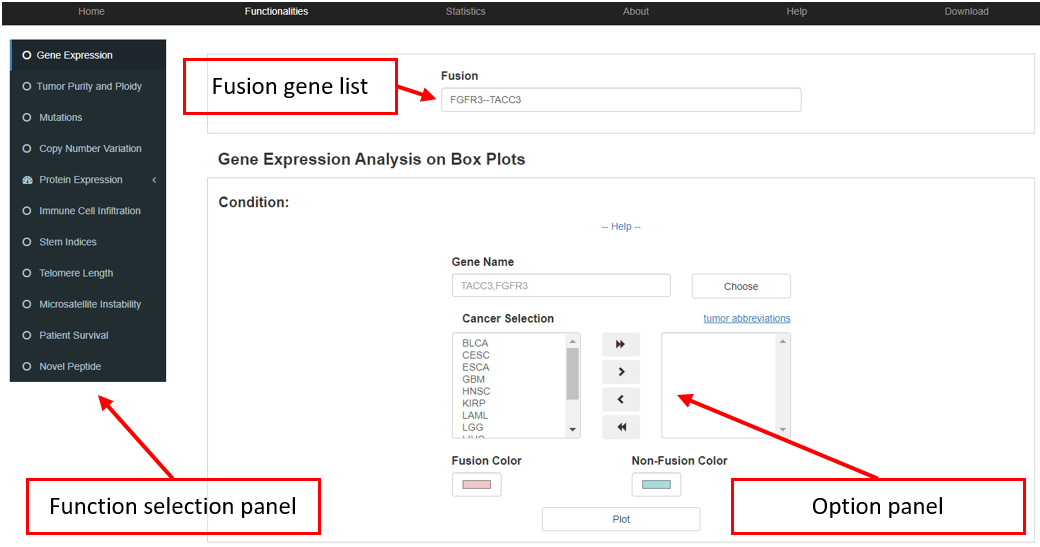
Assume that we would like to search for the fusion event that FGFR3 involved in, and to explore the association between fusion event and other indices. In the gene query interface, we are able to retrieve all the FGFR3-involved fusion events. Fusion gene(s) can be selected into the collection box by clicking the 'Add' or 'Add all' button in the fusion table. And by clicking “Analysis in functionalities” button users are able to access further analysis.

Downstream analysis functions were provided for aforementioned customized fusion genes from the collection box. The analysis tool panel consist of three parts, including an input box, a panel for customized option and the panel for the selection of downstream functionalities. The input box collects fusion gene(s) of interest, which can be filled out manually or directly from the collection box of the browser tool. Downstream functionalities include the gene expression, tumor purity and ploidy, somatic mutation, copy number variation (CNV), protein expression, immune cell infiltration, stem indices, telomere length, microsatellite instability (MSI), survival, and novel peptide. For each function, an option panel is offered to obtain customized layouts (e.g., cancer selection, p.value threshold, and color selection). All these functions provide interactive interfaces for data analysis, customizable plotting, patients grouping and cancer type selection.
3.1 Gene expression
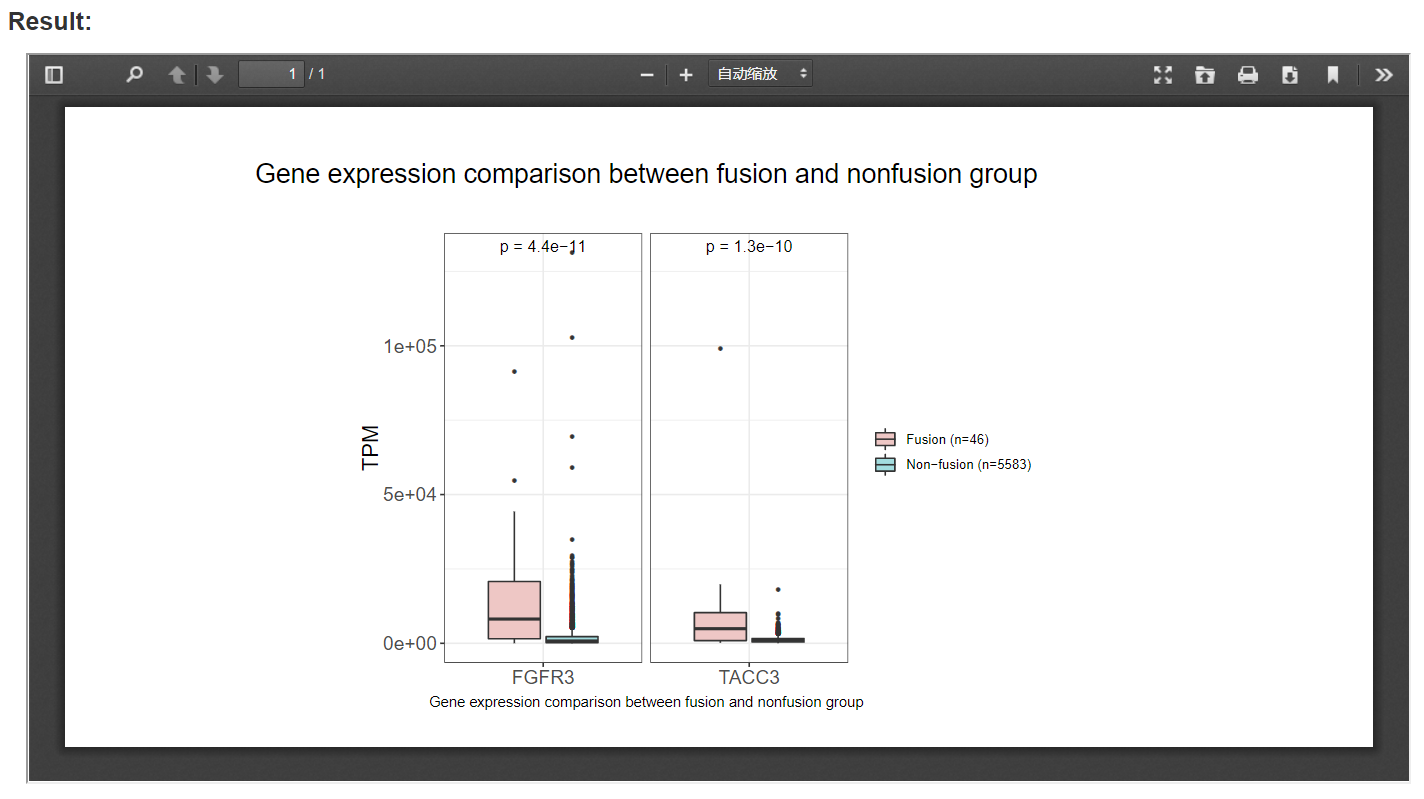
FPIA allows users to freely compare the expression (TPM value) of almost any gene between fusion and non-fusion group, and restrict the analysis in proper cancer combination.
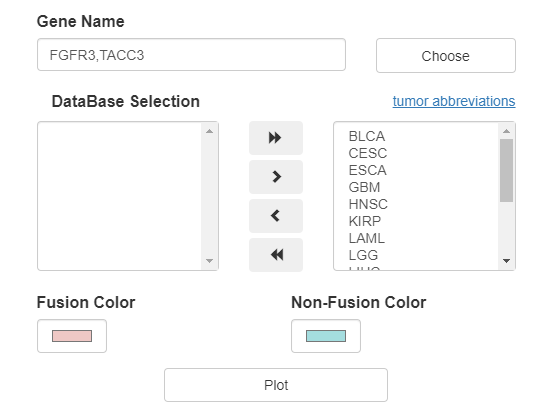
Box plots between patients with and without fusion events are presented, e.g., the box plot in the picture below shows that FGFR3-fusion group have a significantly higher FGFR3 and TACC3 expression than non-fusion group at pan cancer level.
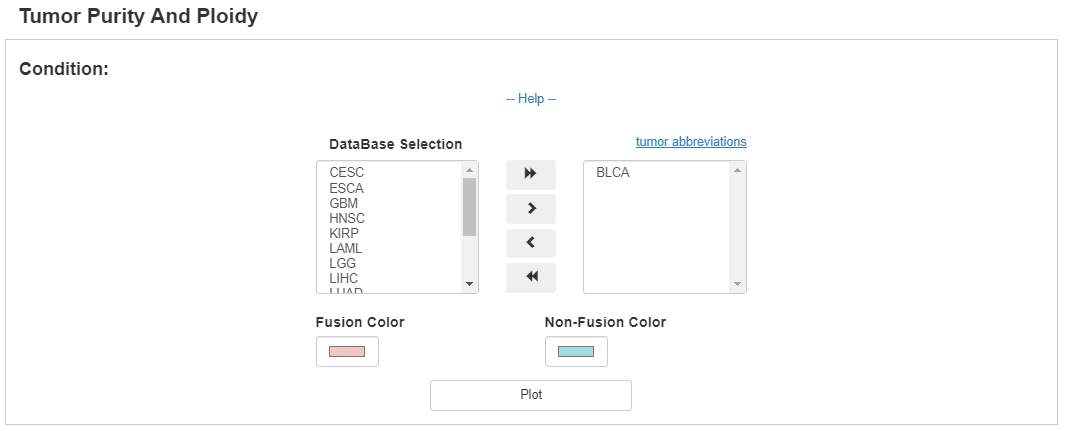
3.2 Tumor purity and ploidy
FPIA offers the comparison of purity and polity indices that associated with any fusion events. When the fusion gene list and cancer of interest is offered, a box plot will be provided to compare the purity and polity indices between fusion and non-fusion group. In the following example, we observed a significant higher level of purity in patients with FGFR3 associated fusion events in BLCA.
3.3 Mutation
FPIA enables users to explore the mutations that associated with fusion events.

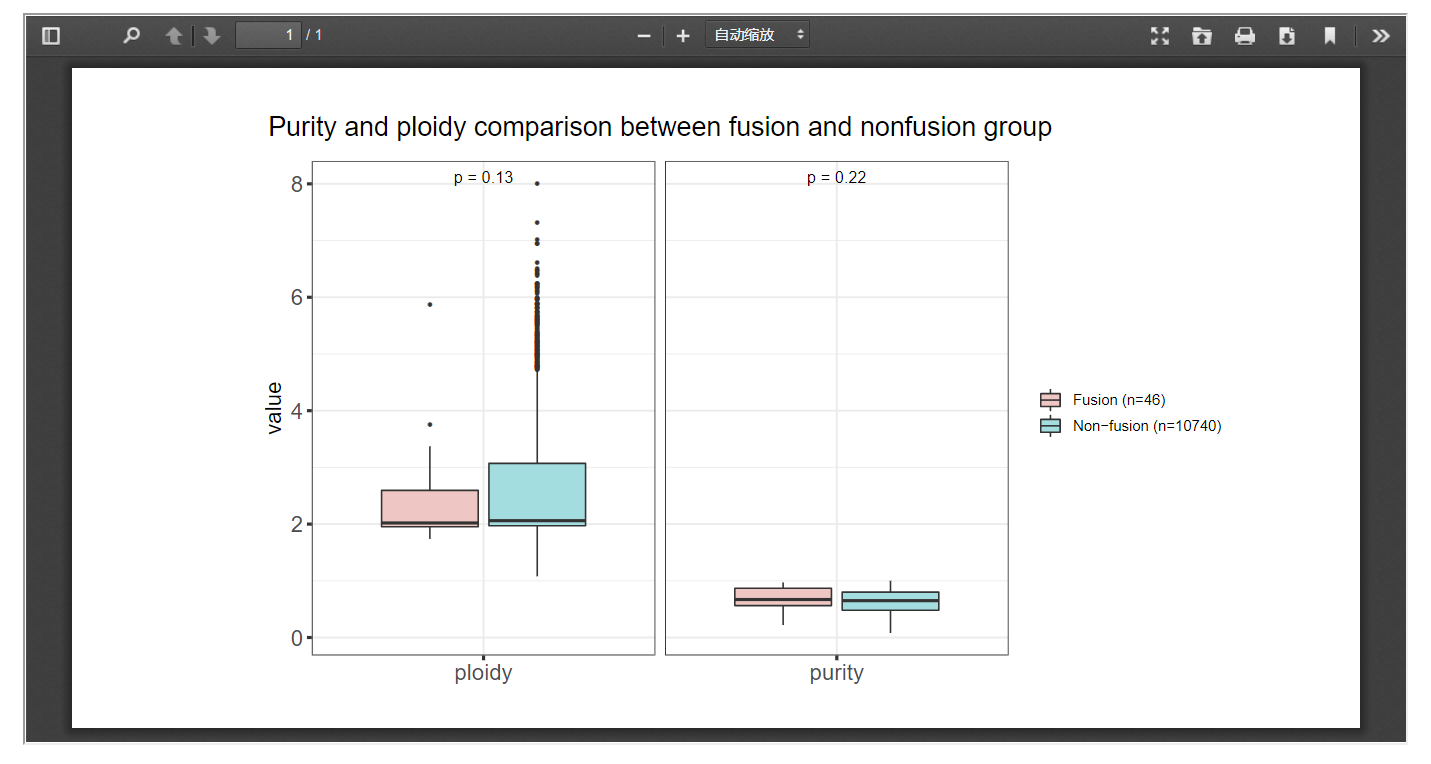
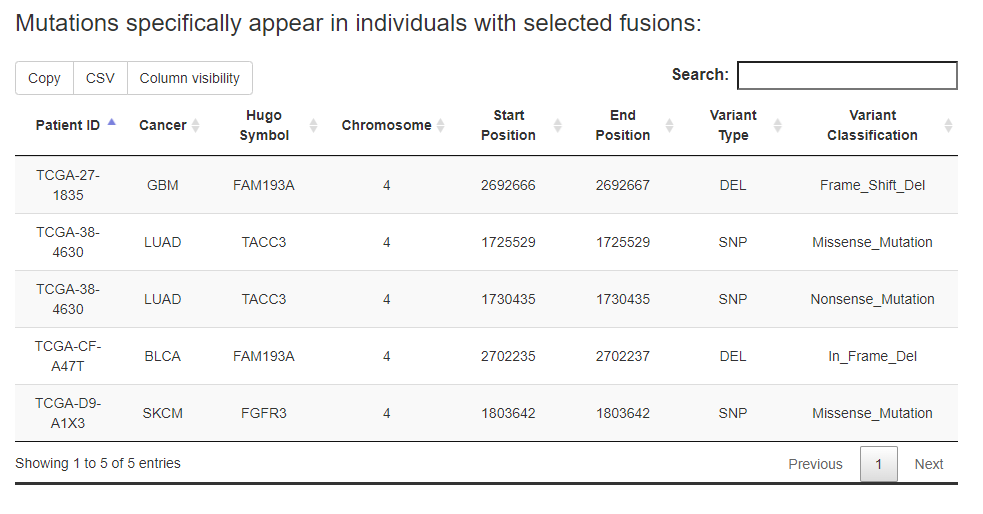
For the specific fusion list, FPIA offers two tables, one for the information of somatic mutations specific to the fusion group and the other for the information of somatic mutations specific to the non-fusion group.
e.g., users are able to identify 3996 mutations that appear specifically in patients with FGFR3 fusion events in pan-cancer.
While the 'In input genes' option in Select mutation location were select, the results can be restricted to mutations locate in the input genes.
While the 'Enriched mutations' option in Select mutaion type were select, the enrichment p-value (calculated by fisher's exact test) would be calculated for each mutation that observed in patients from fusion group. Note: Due to the limitation on the computing performance of our web server, users may have to wait for dozens of minutes (depending on mutation number included) until the calculation was finished. AVOID FREQUENT ATTEMPTS BEFORE IT FINISHED.

3.4 Copy number variation
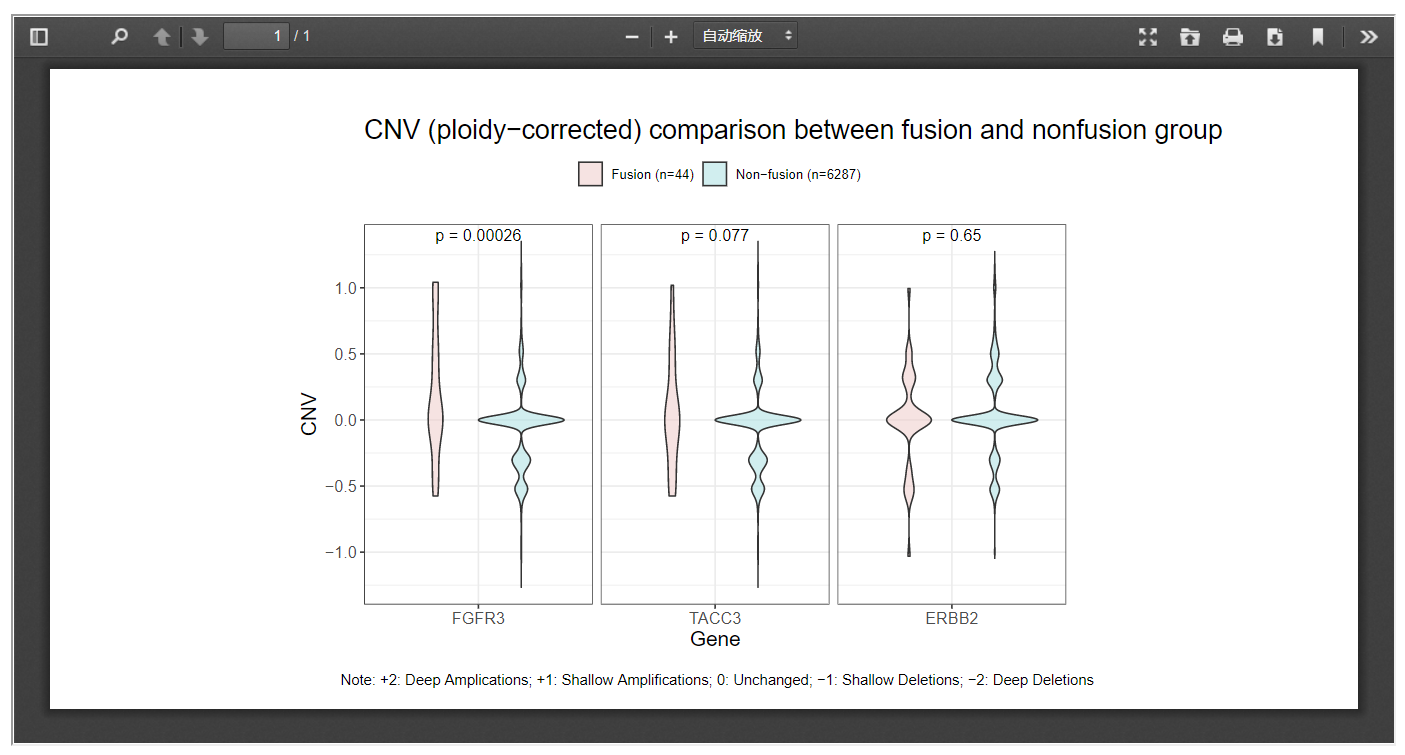
FPIA could display the copy number distribution of interested gene in violin plots, allowing researchers to explore the underlying association between CNV and gene fusion events.
In the following example, the copy number of FGFR3 and TACC3 were inspected between fusion and non-fusion group across pancancer as defined by TMPRSS2-associated fusion event, and fusion patients were observed a significantly higher level of copy number amplification than non-fusion patients.
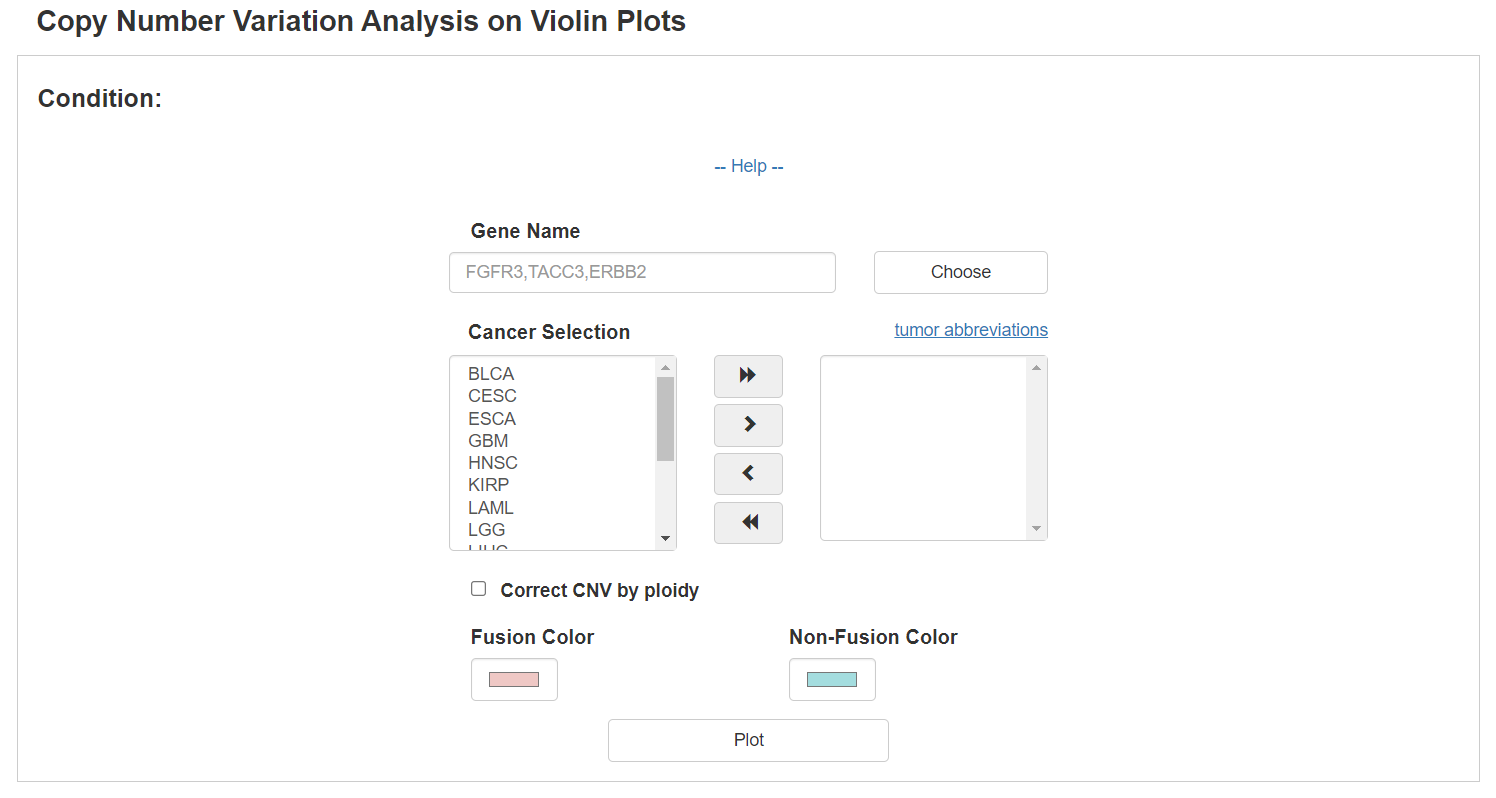

Moreover, when the Correct CNV by ploidy option was checked, ploidy-corrected CNV would be compared.
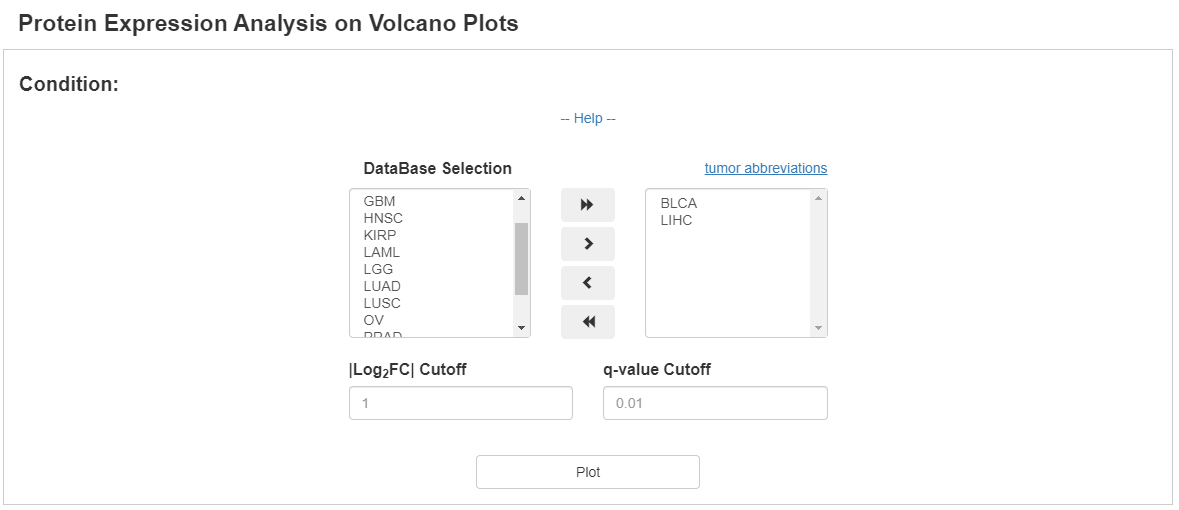
3.5 Protein expression
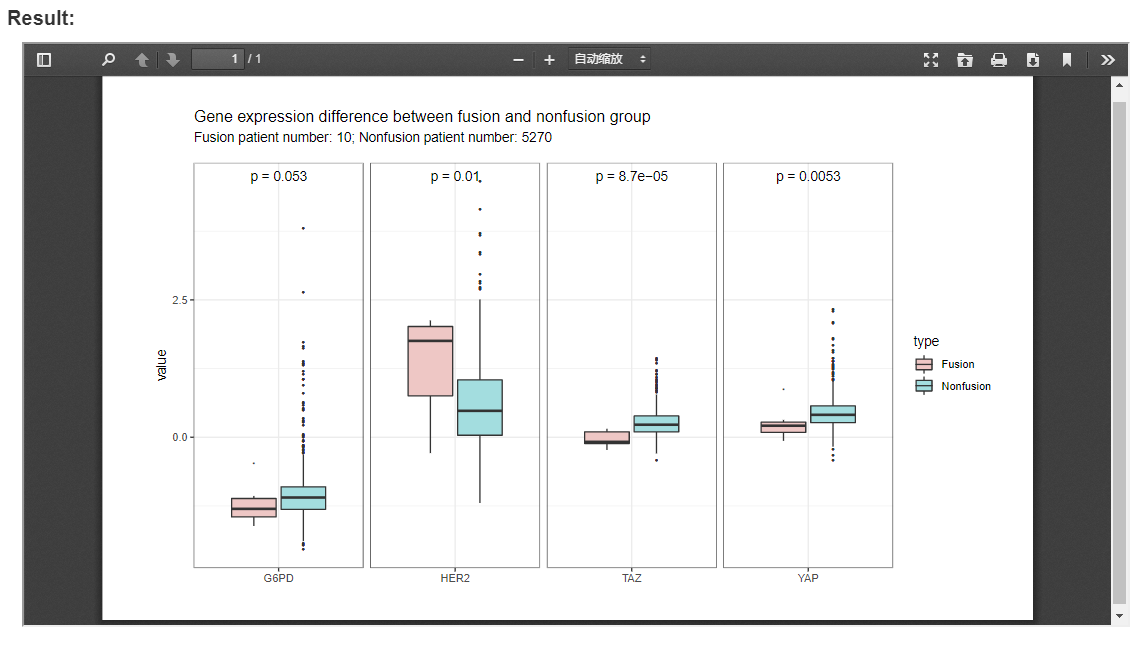
With the expression information of 197 proteins, FPIA provides box plots to compare the expression of proteins between patient with and without fusion events.
The following example compares of expression of four proteins between fusion and non-fusion group in BLCA and LIHC, which indicates that the expression of HER2, TAZ and YAP are significantly associated with fusion events.
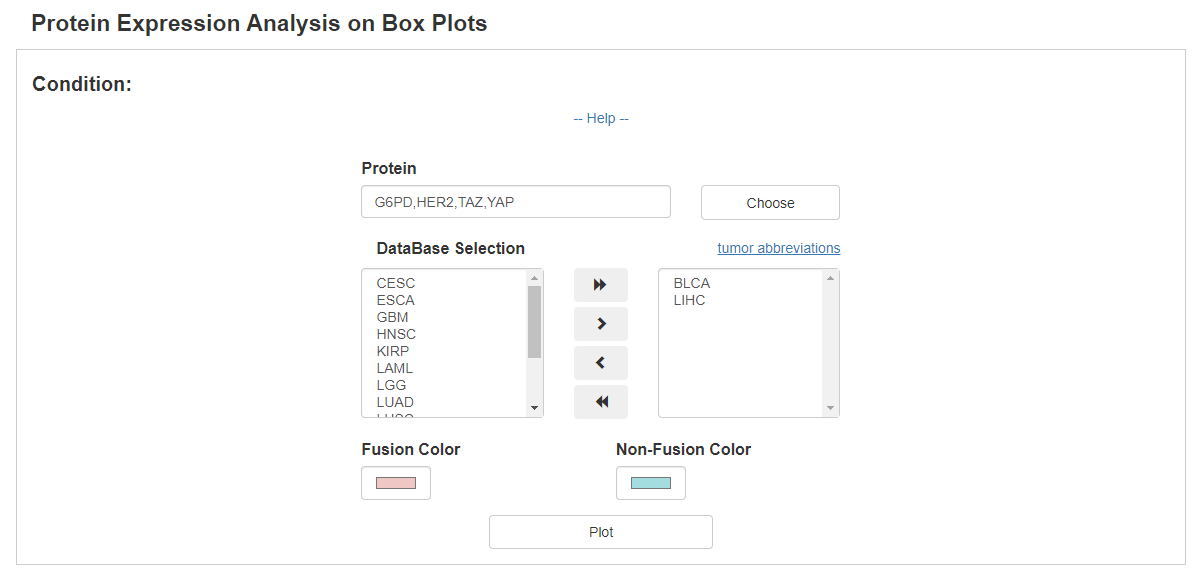
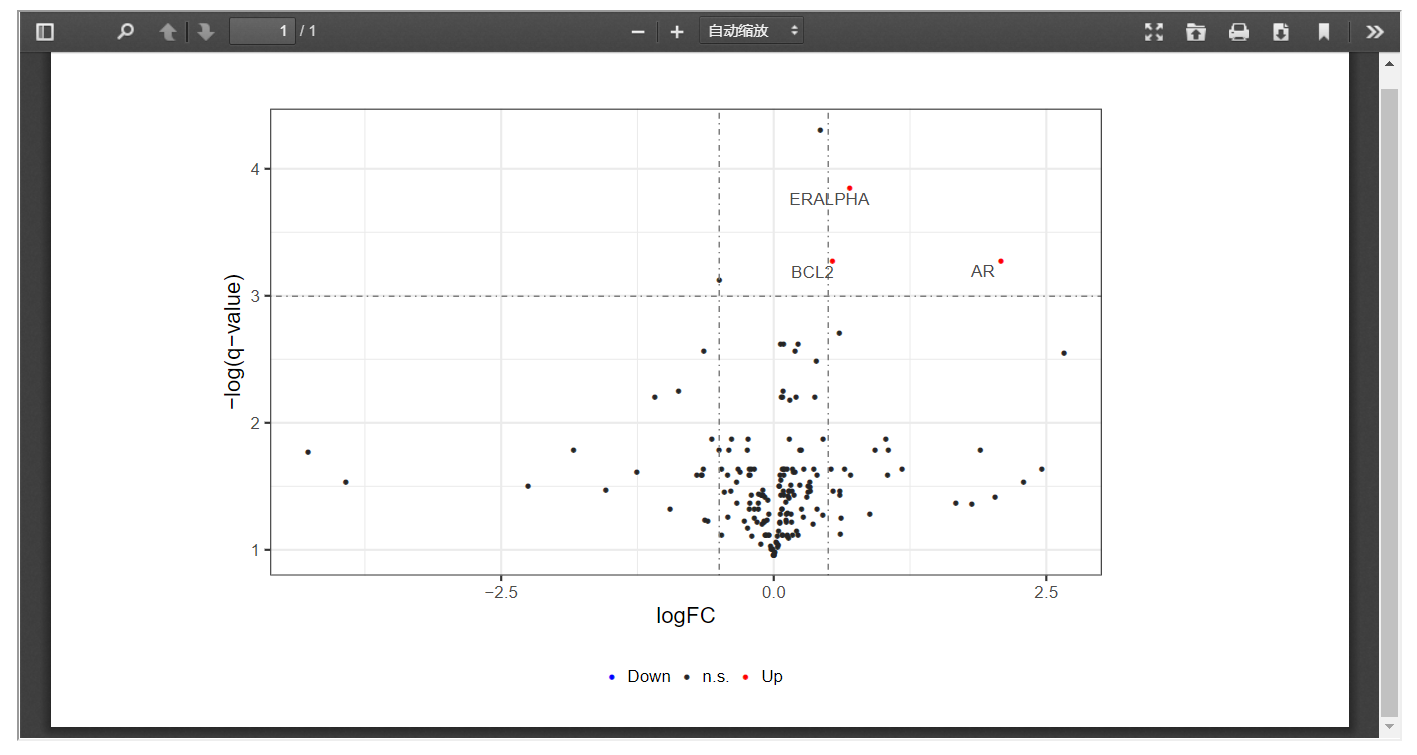
In addition, FPIA can also presents differentially expressed proteins in volcano plots with customized threshold, which allows a better understanding of signaling pathways affected by fusion events.
3.6 Immune cell infiltration
FPIA allows users to compare the infiltration level of various immune cells, and identify immune cells that differentially present in fusion patients and non-fusion patients. Take fusion gene TMPRSS2--ERG as an example, fusion group and non-fusion group were compared in PCPG and PRAD, which presented in box plot. Differentially infiltrated immune cells can further be filtered at the p value threshold of 0.05 (Wilcoxon rank-sum test).


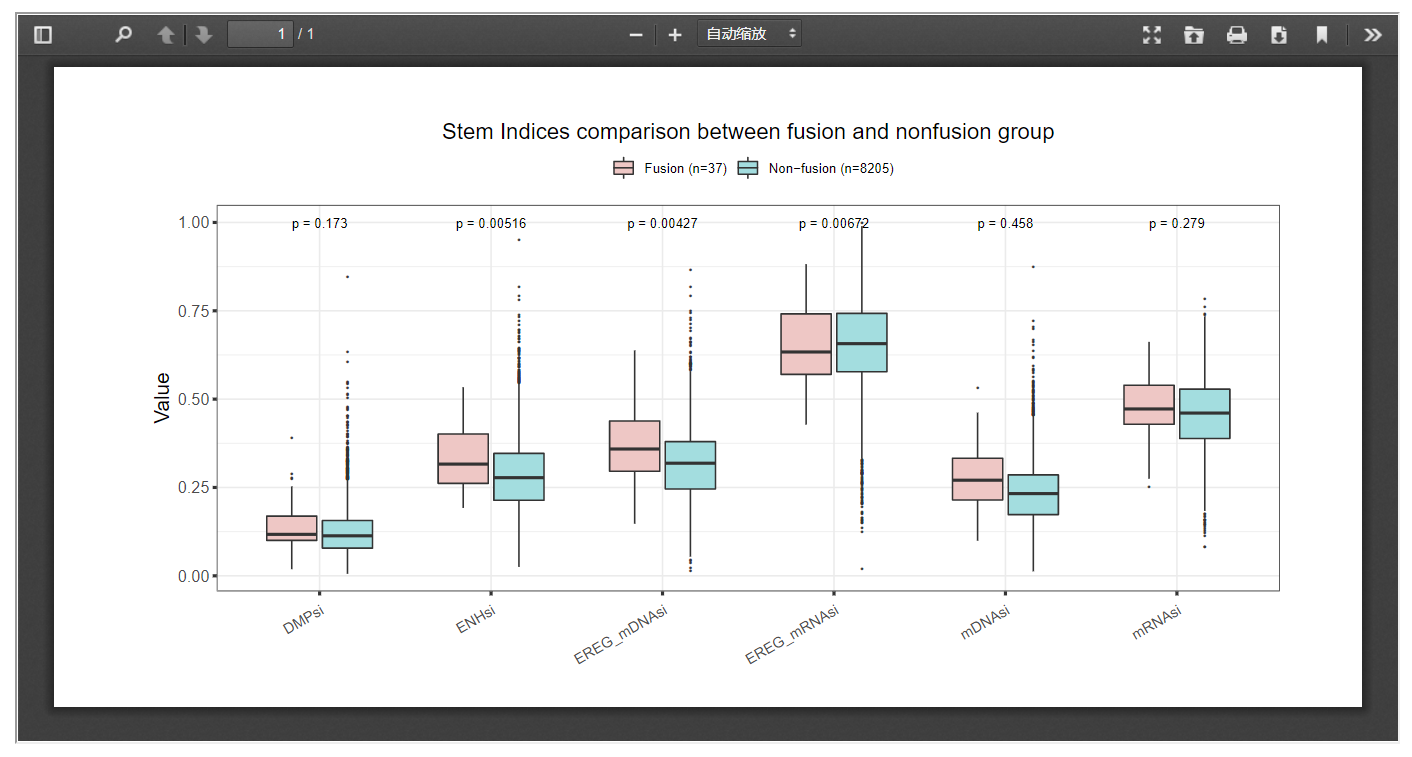
3.7 Stem Indices
Our web server provides a way in which researchers can look into the impact of gene fusion on six tumor stemness indices within certain cancer sets.

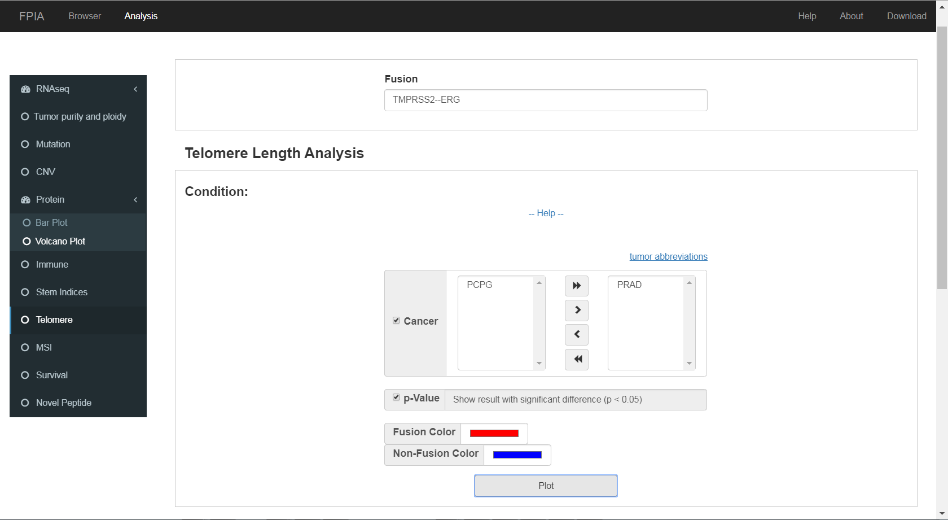
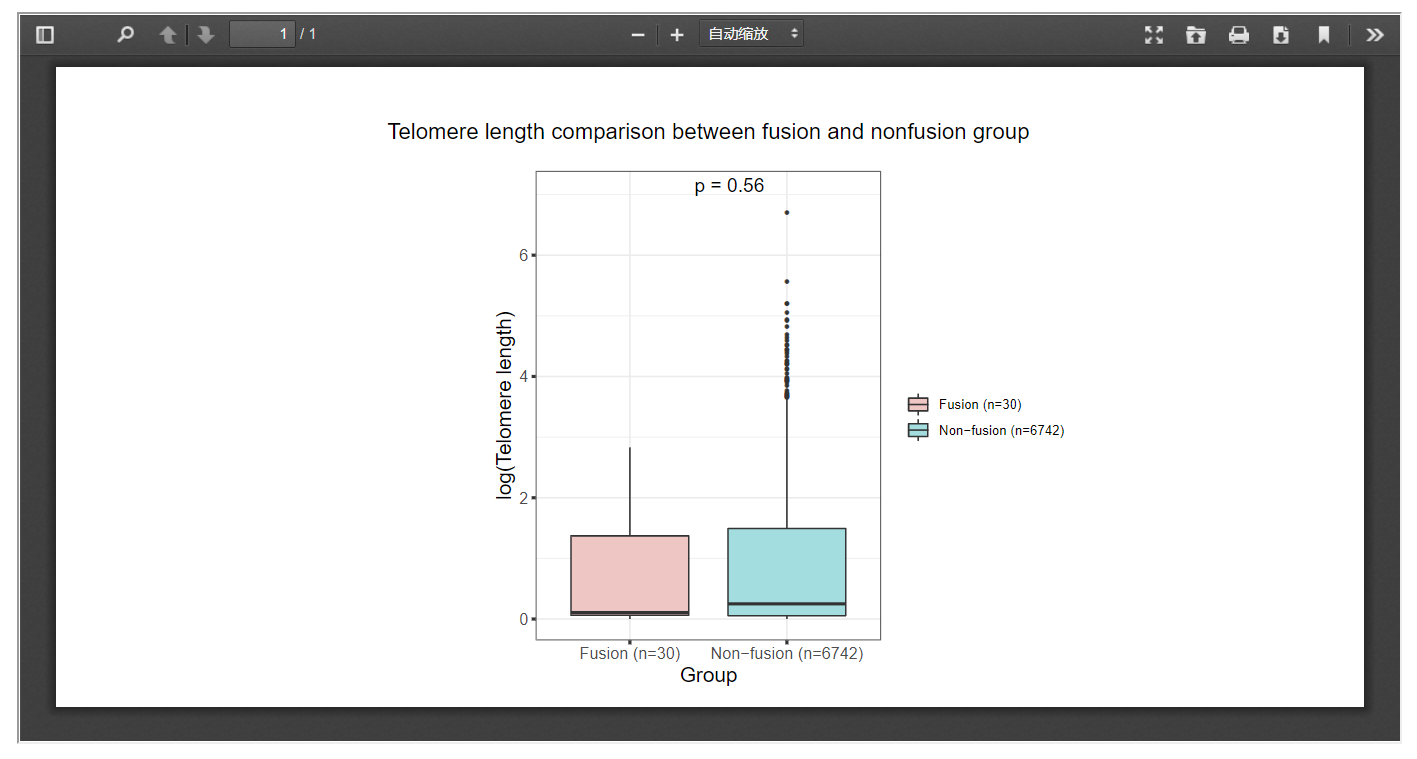
3.8 Telomere length
FPIA offers boxplot-based telomere length comparison between patients with and without specific fusions, which may offer insights into the possible associations between gene fusion and telomere length.
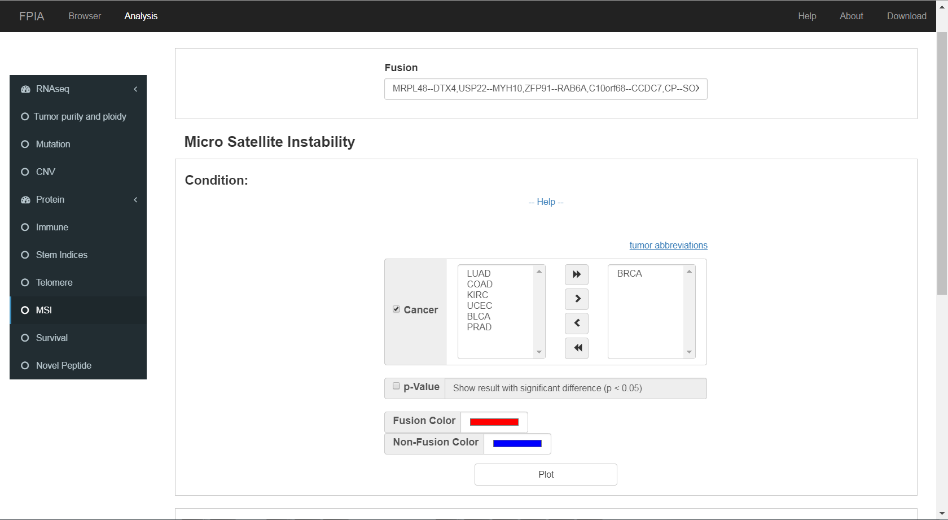
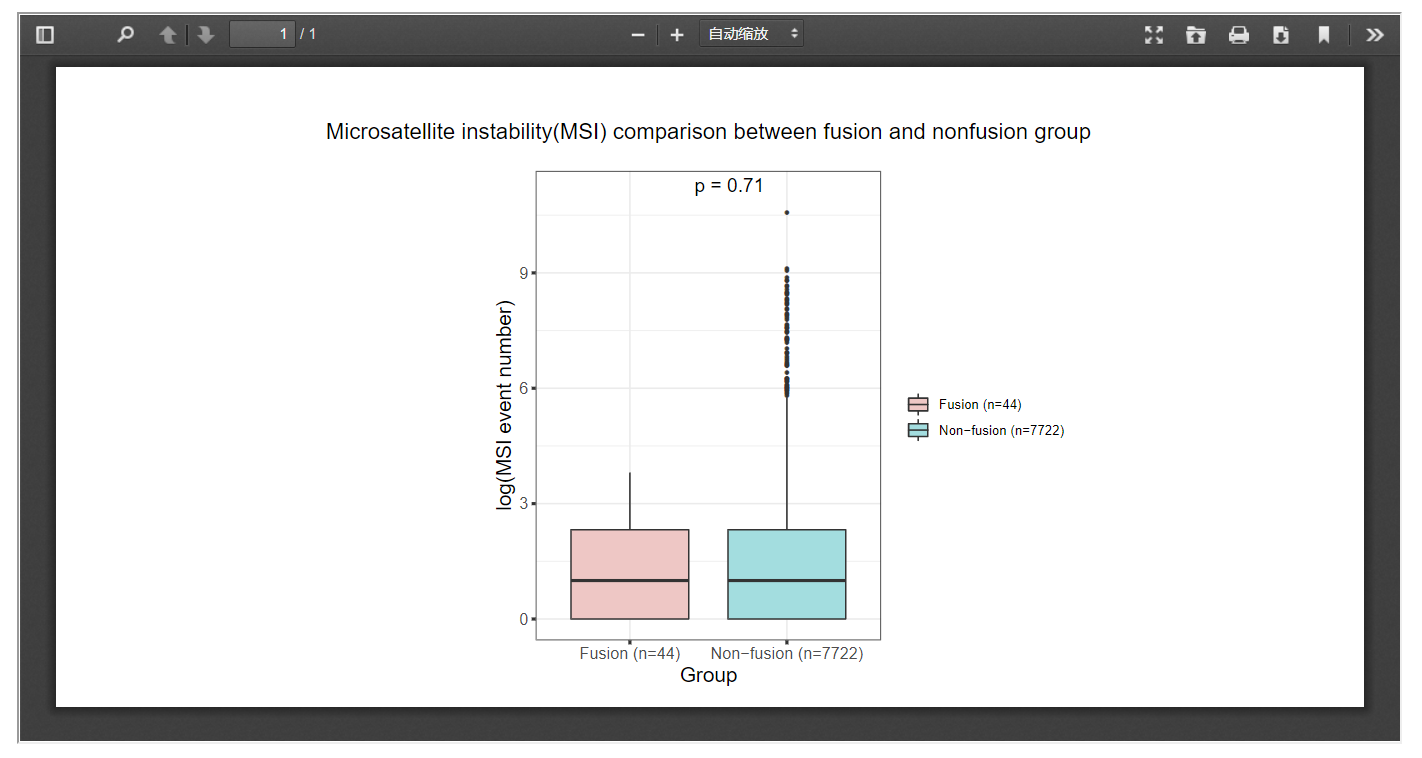
3.9 Microsatellite instability
FPIA allow researchers to compare the MSI indices between fusion group and non-fusion group, which might be useful for the identification of clinical useful targets.
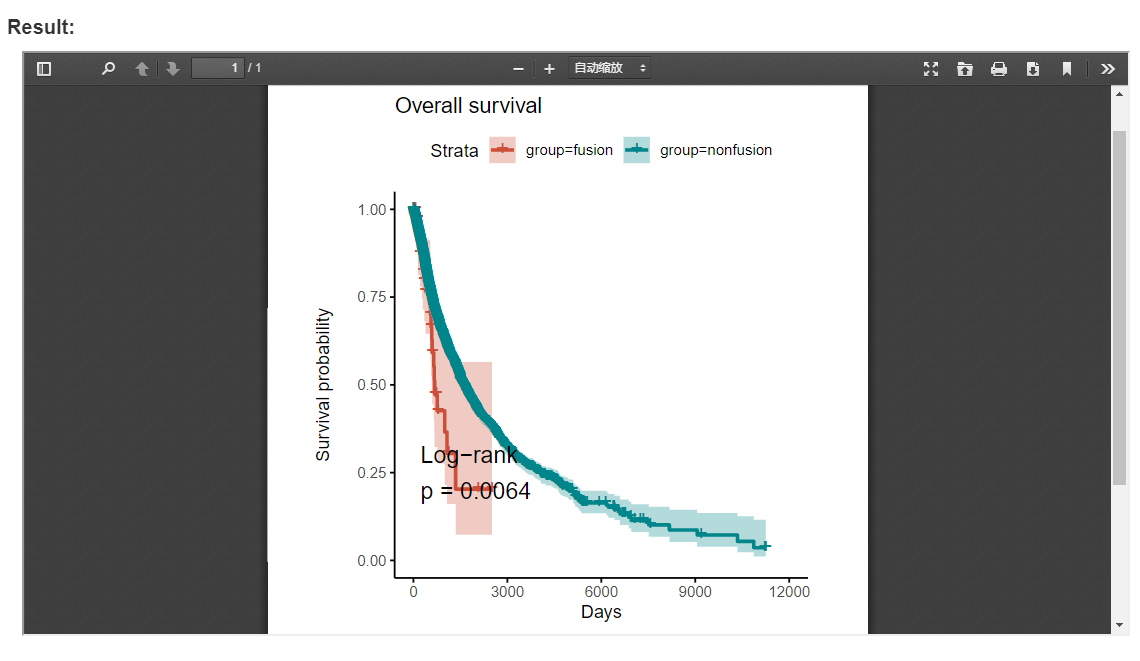
3.10 Patient survival
FPIA provide an easy and customizable way to inspect the influence of fusion combinations of interest on the survival of patients across diverse cancer types. In the survival analysis function, the survival of patient from each group was estimated by the Kaplan-Meier method, and compared using the log-rank test. For each test the survival curves were plotted with 95% confidence intervals shown.

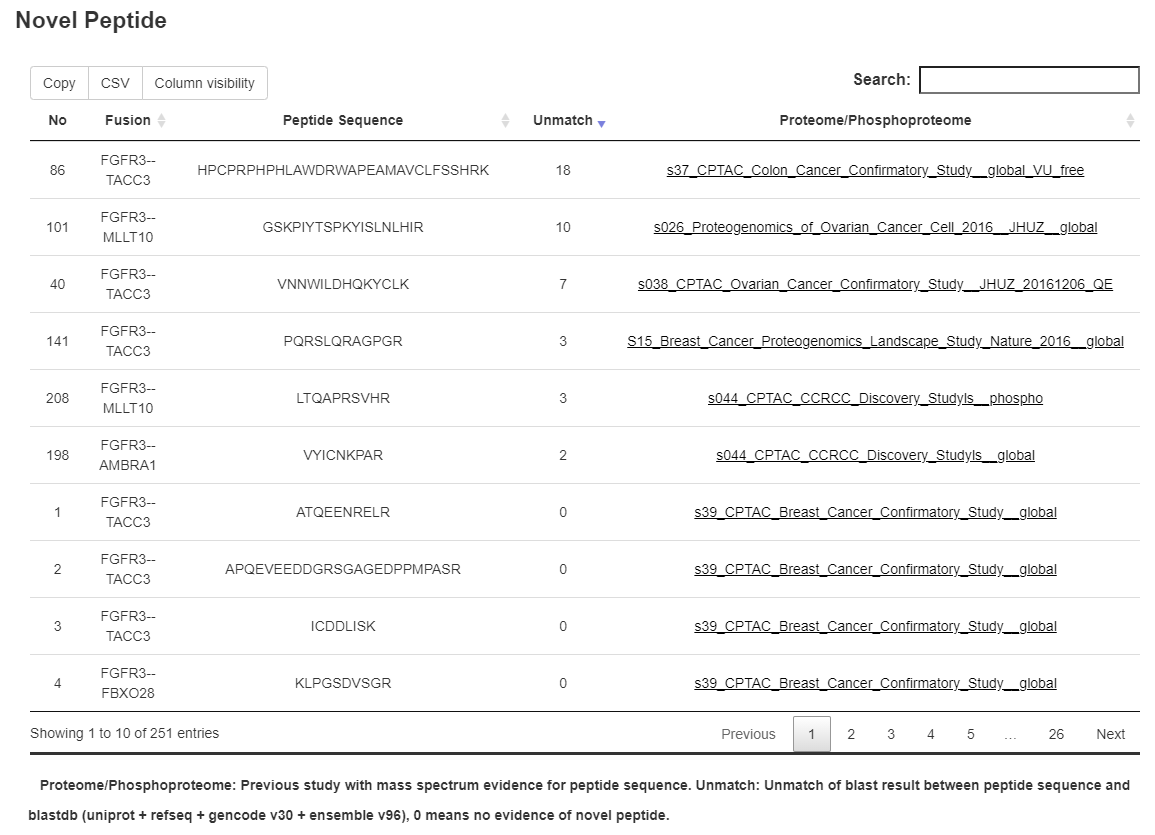
3.11 Novel peptide
In our study, a total of 45,313 MS-supported peptides were identified, 17,195 of which were not reported in recent human protein databases. For any of the fusion gene sets included in the analysis, information of fusion event-derived peptides with MS support from cancers were displayed.